8.7. Writing - Unit 8. World Englishes - SBT Tiếng Anh 9 English Discovery1. Look at the two charts below. Which chart does the paragraph describe? 2. Rewrite the following sentences. 3. Look at the chart below and complete the paragraph with the correct form of the words given in brackets. Quảng cáo
Lựa chọn câu để xem lời giải nhanh hơn
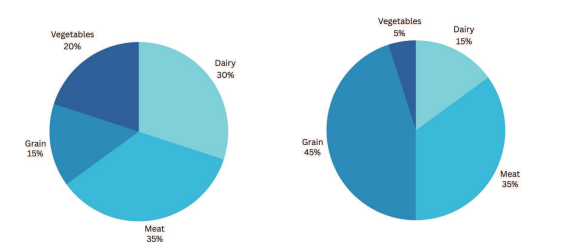
Bài 1 1. Look at the two charts below. Which chart does the paragraph describe? (Hãy xem hai biểu đồ bên dưới. Đoạn văn mô tả biểu đồ nào?)
However, the amount of grain alone constitutes almost a half of all agricultural products. The figure of meat products is 35% - which is not as high as expected. The proportion of dairy products makes up merely a half of meat. The least produced products are vegetables that account for 5% of all graph. (Tuy nhiên, riêng lượng ngũ cốc đã chiếm gần một nửa tổng số sản phẩm nông nghiệp. Con số sản phẩm thịt là 35% - không cao như mong đợi. Tỷ lệ sản phẩm từ sữa chỉ chiếm một nửa lượng thịt. Sản phẩm được sản xuất ít nhất là rau, chiếm 5% tổng số biểu đồ.)
Lời giải chi tiết: The paragraph describes a chart where: - Grain constitutes nearly 50% of all agricultural products. - Meat products account for 35%. - Dairy products make up half of the meat's proportion (around 17.5%). - Vegetables account for 5%. So, the chart that aligns with these percentages is the one showing these proportions of agricultural products, with grain being the dominant category and vegetables being the least produced. If you have the actual charts to compare, you can identify the correct one by matching these proportions directly. Tạm dịch: Đoạn văn mô tả một biểu đồ trong đó: - Ngũ cốc chiếm gần 50% trong tổng số tất cả các sản phẩm nông nghiệp. - Các sản phẩm từ thịt chiếm 35%. - Các sản phẩm từ sữa chiếm một nửa tỷ lệ thịt (khoảng 17,5%). - Rau chiếm 5%. Vì vậy, biểu đồ phù hợp với các tỷ lệ phần trăm này là biểu đồ hiển thị các tỷ lệ sản phẩm nông nghiệp này, trong đó ngũ cốc là loại chiếm ưu thế và rau là loại được sản xuất ít nhất. Nếu bạn có các biểu đồ thực tế để so sánh, bạn có thể xác định biểu đồ chính xác bằng cách khớp trực tiếp các tỷ lệ này. Bài 2 2. Rewrite the following sentences. (Viết lại các câu sau.) 1. Many schools in Europe teach Spanish as a second language. Spanish is _______________________________________________. 2. In the business world, people widely use Japanese to communicate. Japanese is ______________________________________________. 3. Mrs. Hằng taught English to many groups of students. Many groups of students ___________________________________. 4. Nearly 70% of human body is water. The proportion of water ____________________________________. 5. The class has 30 students, all of whom use English very well. English is _______________________________________________. Lời giải chi tiết: 1. Many schools in Europe teach Spanish as a second language. (Nhiều trường học ở Châu Âu dạy tiếng Tây Ban Nha như ngôn ngữ thứ hai.) => Spanish is taught as a second language in many schools in Europe. (Tiếng Tây Ban Nha được dạy như ngôn ngữ thứ hai ở nhiều trường học ở Châu Âu.) 2. In the business world, people widely use Japanese to communicate. (Trong thế giới kinh doanh, mọi người sử dụng tiếng Nhật rộng rãi để giao tiếp.) => Japanese is widely used to communicate in the business world. (Tiếng Nhật được sử dụng rộng rãi để giao tiếp trong thế giới kinh doanh.) 3. Mrs. Hằng taught English to many groups of students. (Cô Hằng dạy tiếng Anh cho nhiều nhóm học sinh.) => Many groups of students were taught English by Mrs. Hằng. (Nhiều nhóm học sinh được cô Hằng dạy tiếng Anh) 4. Nearly 70% of human body is water. (Gần 70% cơ thể con người là nước.) => The proportion of water in the human body is nearly 70%. (Tỷ lệ nước trong cơ thể con người là gần 70%.) 5. The class has 30 students, all of whom use English very well. (Lớp học có 30 học sinh, tất cả đều sử dụng tiếng Anh rất tốt.) => English is used very well by all 30 students in the class. (Cả 30 học sinh trong lớp đều sử dụng tiếng Anh rất tốt.) Bài 3 3. Look at the chart below and complete the paragraph with the correct form of the words given in brackets. (Nhìn vào biểu đồ bên dưới và hoàn thành đoạn văn bằng dạng đúng của các từ cho trong ngoặc.) The bar chart shows the age at which students in Viêt Nam start (1) _______ (learn) English. The (2) _______ (high) percentage, around 45%, indicates that a significant portion of students start learning English between the ages of 6 and 10. This is likely due to the growing (3) _______ (emphasize) on English language education in Vietnamese primary schools. (4) _______ (Follow) this, there's a steady decline in percentages, with around 30% starting between 11 and 15 years old, and a (5) _______ (far) decrease for those starting between 16 and 19 years old (around 20%). Lời giải chi tiết:
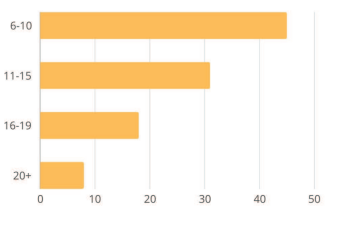
The bar chart shows the age at which students in Vietnam start learning English. The highest percentage, around 45%, indicates that a significant portion of students start learning English between the ages of 6 and 10. This is likely due to the growing emphasis on English language education in Vietnamese primary schools. Following this, there's a steady decline in percentages, with around 30% starting between 11 and 15 years old, and a further decrease for those starting between 16 and 19 years old (around 20%). Tạm dịch: Biểu đồ thanh cho thấy độ tuổi mà học sinh ở Việt Nam bắt đầu học tiếng Anh. Tỷ lệ phần trăm cao nhất, khoảng 45%, cho thấy một bộ phận đáng kể học sinh bắt đầu học tiếng Anh ở độ tuổi từ 6 đến 10. Điều này có thể là do sự chú trọng ngày càng tăng vào giáo dục tiếng Anh ở các trường tiểu học Việt Nam. Sau đó, có sự suy giảm đều đặn về tỷ lệ phần trăm, với khoảng 30% bắt đầu từ độ tuổi từ 11 đến 15 và giảm hơn nữa đối với những người bắt đầu từ độ tuổi từ 16 đến 19 (khoảng 20%). Bài 4 4. Write a report (100-120 words) about the usage of English among different age groups in Việt Nam. Use the chart in Exercise 3 for reference. (Viết một báo cáo (100-120 từ) về việc sử dụng tiếng Anh trong các nhóm tuổi khác nhau ở Việt Nam. Sử dụng biểu đồ trong Bài tập 3 để tham khảo.) Lời giải chi tiết: Report on English Usage Among Different Age Groups in Vietnam The bar chart illustrates English usage among various age groups in Vietnam. Approximately 45% of students begin learning English between the ages of 6 and 10, highlighting a strong emphasis on early English education in primary schools. This trend reflects the increasing importance of English in a globalized world. Following this, around 30% of students start learning English between the ages of 11 and 15, showing a decline in early language acquisition. Lastly, only about 20% of students begin studying English between 16 and 19 years old, indicating a significant drop in engagement. Overall, the data suggests a critical need for continued support and motivation to enhance English proficiency across all age groups in Vietnam. Tạm dịch: Báo cáo về việc sử dụng tiếng Anh trong các nhóm tuổi khác nhau tại Việt Nam Biểu đồ thanh minh họa việc sử dụng tiếng Anh trong các nhóm tuổi khác nhau tại Việt Nam. Khoảng 45% học sinh bắt đầu học tiếng Anh trong độ tuổi từ 6 đến 10, nhấn mạnh sự chú trọng mạnh mẽ vào giáo dục tiếng Anh sớm ở các trường tiểu học. Xu hướng này phản ánh tầm quan trọng ngày càng tăng của tiếng Anh trong một thế giới toàn cầu hóa. Sau đó, khoảng 30% học sinh bắt đầu học tiếng Anh trong độ tuổi từ 11 đến 15, cho thấy sự suy giảm trong việc tiếp thu ngôn ngữ sớm. Cuối cùng, chỉ có khoảng 20% học sinh bắt đầu học tiếng Anh trong độ tuổi từ 16 đến 19, cho thấy sự sụt giảm đáng kể trong việc tham gia. Nhìn chung, dữ liệu cho thấy nhu cầu cấp thiết về sự hỗ trợ và động lực liên tục để nâng cao trình độ tiếng Anh ở mọi nhóm tuổi tại Việt Nam.
|


Danh sách bình luận