


Writing - trang 17 Unit 2 SBT Tiếng anh 12 mớiLook at the line graph and answer the following questions. Quảng cáo
Lựa chọn câu để xem lời giải nhanh hơn
Bài 1 Task 1. Look at the line graph and answer the following questions. (Xem biểu đồ đường và trả lời các câu hỏi dưới đây)
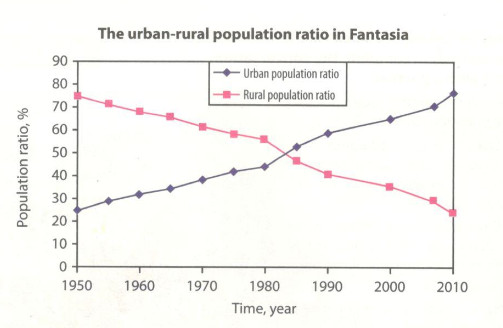
Lời giải chi tiết: 1. What does the graph show? Gợi ý trả lời: It shows the urban-rural population ratio in Fantasia from 1950 to 2010. Tạm dịch: Biểu đồ cho thấy gì? => Nó cho thấy tỷ lệ dân số đô thị và nông thôn ở Fantasia 1950-2010.
2. What information is shown on the vertical axis? Gợi ý trả lời: The population ratio in percentage. Tạm dịch: Thông tin gì được thể hiện trên trục tung? => Tỷ lệ dân số theo phần trăm.
3. What information is shown on the horizontal axis? Gợi ý trả lời: The 60-year period from 1950 to 2010 (divided by ten-year intervals). Tạm dịch: Thông tin gì được thể hiện trên trục hoành? => Giai đoạn 60 năm 1950-2010 (chia khoảng thời gian mười năm).
4. What patterns can you see? Gợi ý trả lời: The urban population ratio increased, and the rural population ratio decreased. Tạm dịch: Bạn có thể thấy đường hướng diễn ra nào? => Tỷ lệ dân số đô thị tăng lên, và tỷ lệ dân số nông thôn giảm.
5. What comparisons can you make? Gợi ý trả lời: The differences between the two patterns. Tạm dịch: Những so sánh nào bạn có thể thực hiện? => Sự khác biệt giữa hai mô hình. Bài 2 Task 2. Rewrite the sentences without changing their meaning. (Viết lại câu mà không làm thay đổi nghĩa) 1. The urban population ratio rose steadily throughout the period. Gợi ý trả lời: There was a steady rise in the urban population ratio throughout the period. Giải thích: rise (v): tăng lên rise (n): tăng lên + in something steady (adj) steadily (adv): ổn định Trạng ngữ đứng sau động từ, tính từ đứng trước danh từ. Tạm dịch: Có sự gia tăng ổn định trong tỷ lệ dân số đô thị trong suốt thời kỳ.
2. There was a continuous fall in the rural population ratio during this 60-year period. Gợi ý trả lời: The rural population ratio fell continuously during this 60-year period. Giải thích: fall (v): rơi, giảm fall (n): sự thụt giảm + in something continuous (adj) - continuously (adv): liên tục, tiếp tục Trạng ngữ đứng sau động từ, tính từ đứng trước danh từ. Tạm dịch: Tỷ lệ dân số nông thôn giảm dần trong giai đoạn 60 năm này. 3. The urban population ratio rose from 25% to 45% between 1950 and 1980. Gợi ý trả lời: There was a rise/increase of 20% in the urban population ratio between 1950 and 1980. Giải thích: rise (v) from .... to.....: tăng từ..... đến...... rise (n) of + lượng tăng Tạm dịch: Có sự tăng 20% trong tỷ lệ dân số đô thị từ năm 1950 đến 1980. 4. From 1980 to 2010, there was a steady increase in the ratio of urban population. Gợi ý trả lời: From 1980 to 2010, the ratio of urban population increased steadily. Giải thích: increase (n) (v): tăng steady (adj) steadily (adv): ổn định Trạng ngữ đứng sau động từ, tính từ đứng trước danh từ. Tạm dịch: Từ 1980 đến 2010, tỷ lệ dân thành thị tăng đều đặn. 5. The rural population ratio decreased by 50% from 1950 to 2010. Gợi ý trả lời: There was a decrease/fall of 50% in the rural population ratio from 1950 to 2010. Giải thích: decrease (n) of + lượng giảm: lượng giảm bao nhiêu decrease (v) by + lượng giảm: giảm bao nhiêu Tạm dịch: Tỷ lệ dân số nông thôn đã giảm 50% từ năm 1950 đến 2010. Bài 3 Task 3. Write a description (of 130-150 words) of the trends in the graph. (Viết đoạn mô tả (130-150 từ) về các xu hướng trên biểu đồ.) Lời giải chi tiết: The line graph illustrates the ratio between urban and rural population in Fantasia over a 60-year period from 1950 to 2010. Overall, the ratio of urban population went up continuously, while the rural population ratio experienced a steady fall. In 1950,75% of the population lived in rural areas compared to only 25% of urban dwellers at the time. The next 30-year period saw some changes in the trend with more people (around 45%) living in urban areas and fewer people (less than 60%) living in rural areas. Towards the end of the period, the trend was totally reversed. In 2010, around 75% of the population lived in urban areas, whereas just merely 25% still lived in rural areas. In summary, as time went by, more and more people chose the city over rural areas to settle down. Tạm dịch: Biểu đồ minh họa tỷ lệ giữa số dân đô thị và nông thôn ở Fantasia trong khoảng thời gian 60 năm từ năm 1950 đến năm 2010. Nhìn chung, tỷ lệ dân số đô thị đã tăng liên tục, trong khi tỷ lệ dân cư nông thôn đã giảm ở mức ổn định. Năm 1950,75% dân số sống ở khu vực nông thôn so với chỉ 25% của cư dân đô thị vào thời điểm đó. khoảng thời gian 30 năm sau đã thấy một số thay đổi trong xu hướng với nhiều người hơn (khoảng 45%) sống ở khu vực đô thị và ít người hơn (dưới 60%) sống ở khu vực nông thôn. Đến cuối giai đoạn này, xu hướng đã hoàn toàn đảo ngược. Trong năm 2010, khoảng 75% dân số sống ở khu vực đô thị, trong khi đó chỉ đơn thuần 25% vẫn còn sinh sống ở các khu vực nông thôn. Loigiaihay.com  Bình luận Bình luận
Group 2K8 ôn Thi ĐGNL & ĐGTD Miễn Phí
|


Danh sách bình luận