


3e. Writing trang 29 - Unit 3. The mass media - SBT Tiếng Anh 12 Bright1. Writing a pie chart report 2. Read the sentences (1-5) and replace the words or phrases in bold with those in the list. 3. Read the pie chart about television viewers in the Spanish village and match the questions with the answers. Quảng cáo
Lựa chọn câu để xem lời giải nhanh hơn
Bài 1 Writing a pie chart report (Viết báo cáo về biểu đồ tròn)
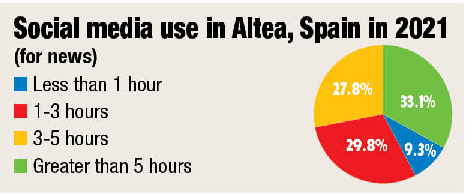
(Lượng sử dụng mạng xã hội để xem tin tức ở Altea, Tây Ban Nha vào năm 2021 - Ít hơn 1 tiếng đồng hồ - 1 đến 3 tiếng đồng hồ - 3 đến 5 tiếng đồng hồ - Nhiều hơn 5 tiếng đồng hồ) 1. Read the report and fill in the gaps (1-5) with one suitable word from the list. (Đọc bài báo cáo và điền vào các chỗ trống (1-5) với một từ phù hợp từ danh sách.) • overall • illustrates • majority • 27,8 % • by contrast This pie chart 1) _____ the results of a recent survey on social media use. The survey was conducted at a small village Altea in Spain in 2021 and categorised the social media use by the amount of time spent. 2) _____ the chart indicates that the community at Altea relies on social media as their primary source of news. According to the most significant portion, 33.1% of users go online approximately more than 5 hours a day. Next to that, with a lower portion of the total 3) _____ of the users are on social media for 3 to 5 hours. 4) _____ only 9.3 % of the locals use the Internet for less than 1 hour to keep up to date with the latest news. Furthermore, 29,8 % of the users spent 1-3 hours on social media. All in all, it is evident from the survey data that the 5) _____ of the Spanish village residents use social media as their primary source of information, while those who do not spend much time online account for only a low percentage. Lời giải chi tiết:
This pie chart illustrates the results of a recent survey on social media use. The survey was conducted at a small village Altea in Spain in 2021 and categorised the social media use by the amount of time spent. Overall the chart indicates that the community at Altea relies on social media as their primary source of news. According to the most significant portion, 33.1% of users go online approximately more than 5 hours a day. Next to that, with a lower portion of the total 27,8% of the users are on social media for 3 to 5 hours. By contrast only 9.3 % of the locals use the Internet for less than 1 hour to keep up to date with the latest news. Furthermore, 29,8 % of the users spent 1-3 hours on social media. All in all, it is evident from the survey data that the majority of the Spanish village residents use social media as their primary source of information, while those who do not spend much time online account for only a low percentage. (Biểu đồ tròn này thể hiện kết quả của một cuộc khảo sát gần đây về việc sử dụng mạng xã hội. Khảo sát đã được thực hiện ở một ngôi làng nhỏ tên Altea ở Tây Ban Nha vào năm 2021 và được phân loại việc sử dụng mạng xã hội theo số giờ dùng. Tổng thể thì biểu đồ cho thấy cộng đồng ở Altea dựa vào mạng xã hội như là nguồn tin tức chính. Theo phần lớn nhất thì 33,1% người dùng lên mạng xấp xỉ hơn 5 giờ một ngày. Kế đó với tỉ lệ thấp hơn với tổng cộng 27,8% người dùng lên mạng xã hội từ 3 đến 5 giờ. Ngược lại, chỉ có 9,3% người dân địa phương sử dụng Internet thấp hơn một giờ để cập nhật tin tức. Hơn nữa, có 29,8% ngguoiwf dùng mạng xã hội từ 1 – 3 tiếng. Nói tóm lại, theo dữ liệu khảo sát thì rõ rang phần lớn cư dân trong làng đó ở Tây Ban Nha dùng mạng xã hội làm nguồn thông tin chính, trong khi những người không dành nhiều thời gian cho mạng xã hội chỉ chiếm một tỉ lệ nhỏ.) Bài 2 2. Read the sentences (1-5) and replace the words or phrases in bold with those in the list. (Đọc các câu (1-5) và thay thế các từ hoặc cụm từ in đậm với các từ bên từ trong danh sách.) • with reference to • while • Moreover • indicates • in conclusion 1. All in all, more people listen to podcasts than they did five years ago. 2. The chart shows a very interesting trend. 3. Furthermore, we see that 1 in 3 women post stories on an everyday basis. 4. According to the graph, 32% Internet users are women, whereas 68% are man. 5. Regarding the most significant portion of the graph, it is clear that those watching television outnumber those reading news online. Phương pháp giải: • with reference to: về • while: trong khi • Moreover: hơn nữa • indicates: chỉ ra • in conclusion: kết luận Lời giải chi tiết:
1. All in all/ In conclusion, more people listen to podcasts than they did five years ago. (Nhìn chung thì/Kết luận là, ngày càng nhiều người nghe radio kĩ thuật số hơn năm năm trước.) 2. The chart shows/indicates a very interesting trend. (Biểu đồ cho thấy/ chỉ ra một xu hướng rất thú vị.) 3. Furthermore/ Moreover, we see that 1 in 3 women post stories on an everyday basis. (Hơn nữa, chúng ta thấy rằng cứ 3 phụ nữ thì có một người đăng câu chuyện khoảnh khắc hằng ngày.) 4. According to the graph, 32% Internet users are women, whereas/while 68% are man. (Theo biểu đồ thì co 32% người dùng Internet là phụ nữ, nhưng/trong khi 68% người dùng là nam.) 5. Regarding/With reference to the most significant portion of the graph, it is clear that those watching television outnumber those reading news online. (Về phần có tỷ lệ lớn nhất trên biểu đồ, rõ ràng là số người xem ti vi đông hơn những người đọc báo trên mạng.) Bài 3 3. Read the pie chart about television viewers in the Spanish village and match the questions with the answers. (Đọc biểu đồ tròn về số người xem ti vi ở một làng ở Tây Ban Nha và nối các câu hỏi với câu trả lời.) (Việc sử dụng tivi ở Altea, Tây Ban Nha trong năm 2022 (dành cho tin tức và giải trí) (235 phản hồi ở Altea, Tây Ban Nha) ít hơn 1 tiếng; 1 đến 2 tiếng; 3 đến 5 tiếng; nhiều hơn 5 tiếng
Lời giải chi tiết:
1-c: What does the chart show? The amount of time spent on watching television. (Biểu đồ cho thấy gì? Thời lượng dành ra để xem ti vi?) 2-a: What is the visible trend that the chart indicates? People in the village most likely to reply on television as their primary source of news and entertainment. (Xu hướng nào ta có thể nhìn thấy được mà biểu đồ chỉ ra? Mọi người trong làng hầu hết sẽ phản hồi tivi là nguồn tin tức và giải trí chính của họ.) 3-b: What is the main conclusion that can be drawn regarding the results of the chart? Most residents of the village spent long hours using television to get their news and for entertainment, while those who spent little time in front of the TV accounted for only 8% of total use in the area. (Kết luận chính có thể vẽ ra theo kết quả của biểu đồ là gì? Hầu hết các dư dân ở làng dành nhiều giờ để xem ti vi để cập nhật tin tức và giải trí, trong khi những người dành ít thời gian xem ti vi chỉ chiếm có 8% tổng lượng sử dụng trong khu vực.) Bài 4 5. Write a report using the information from the pie chart in Exercise 3 (about 180-200 words). (Viết một báo dùng thông tin từ biểu đồ tròn trong Bài tập 3 (khoảng 180 – 200 từ.) Paragraph 1: writing about the purpose of the chart, describing the general trend (Đoạn 1: viết về mục đích của biểu đồ, mô tả xu hướng chung) Paragraph 2: describing and comparing the sections of the chart in detail (Đoạn 2: mô tả và so sánh chi tiết các phần của biểu đồ) Paragraph 3: summarising the chart and explaining what the results indicate (Đoạn 3: tóm tắt biểu đồ và giải thích những điều kết quả chỉ ra.) Lời giải chi tiết: This pie chart illustrates the results of a recent survey on television use. In 2022, a survey was carried out in a small village called Altea in Spain, classifying television consumption based on the amount of time spent watching. In general, the chart indicates that people in Altea rely on television as their primary source of news and entertainment. According to the most significant portion, 42% of people watch television approximately for than five hours a day. Besides, with a lower portion of 38% of the people are watching television for 3 to 5 hours. Whereas, only 8% of the locals use the television for less than 1 hour for news updates and entertainment. Moreover, 12% of the people spent 1-2 hours on television. In conclusion, it is clear from the survey data that most residents of the village spent long hours using television to get their news and for entertainment, while those who spent little time in front of the TV accounted for only 8% of total use in the area. (Biểu đồ hình tròn này thể hiện kết quả của một cuộc khảo sát gần đây về việc sử dụng ti vi. Vào năm 2022, một cuộc khảo sát đã được thực hiện tại một ngôi làng nhỏ tên là Altea ở Tây Ban Nha, phân loại mức sự dụng tivi dựa trên lượng thời gian xem. Nhìn chung, biểu đồ chỉ ra rằng người dân ở Altea coi tivi là nguồn tin tức và giải trí chính. Theo phần quan trọng nhất, 42% người dân xem tivi khoảng hơn 5 giờ mỗi ngày. Bên cạnh đó, tỷ lệ thấp hơn là 38% người dân xem tivi từ 3 đến 5 giờ. Trong khi đó, chỉ có 8% người dân địa phương sử dụng tivi dưới 1 giờ để cập nhật tin tức và giải trí. Hơn nữa, 12% số người dành 1-2 giờ trên tivi. Tóm lại, dữ liệu khảo sát cho thấy rõ rằng hầu hết cư dân trong làng dành nhiều thời gian sử dụng tivi để xem tin tức và giải trí, trong khi những người dành ít thời gian trước TV chỉ chiếm 8% tổng thời gian sử dụng trong làng. khu vực.)  Bình luận Bình luận
Group 2K8 ôn Thi ĐGNL & ĐGTD Miễn Phí
|


Danh sách bình luận