In about 120-150 words, summarise the information in the table below.
(Trong khoảng 120-150 từ, hãy tóm tắt thông tin trong bảng bên dưới.)
The number of schools in Viet Nam from 2019 to 2021
(Số trường học ở Việt Nam từ năm 2019 đến năm 2021)
|
|
2019 |
2022 |
2021 |
|
Upper Secondary Schools |
2,371 |
2,373 |
2,380 |
|
Lower Secondary Schools |
9,047 |
8,820 |
8,744 |
|
Primary Schools |
12,961 |
12,665 |
12,527 |
Bài mẫu 1:
The table provides data on the number of schools in Vietnam from 2019 to 2021, categorized into upper secondary, lower secondary, and primary schools. From 2019 to 2021, there was a slight increase in the number of upper secondary schools, rising from 2,371 to 2,380. However, there was a decrease in both lower secondary and primary schools during the same period. Lower secondary schools decreased from 9,047 in 2019 to 8,744 in 2021, while primary schools decreased from 12,961 to 12,527. Overall, the trends indicate a slight fluctuation in the number of schools, with some categories experiencing minor increases and others showing slight declines over the three-year period.
Tạm dịch:
Bảng cung cấp số liệu về số lượng trường học ở Việt Nam từ năm 2019 đến năm 2021, được phân thành các trường trung học phổ thông, trung học cơ sở và tiểu học. Từ năm 2019 đến năm 2021, số lượng trường trung học phổ thông tăng nhẹ, tăng từ 2.371 lên 2.380. Tuy nhiên, có sự sụt giảm ở cả cấp trung học cơ sở và tiểu học trong cùng thời kỳ. Số trường trung học cơ sở giảm từ 9.047 năm 2019 xuống 8.744 năm 2021, trong khi trường tiểu học giảm từ 12.961 xuống 12.527. Nhìn chung, các xu hướng cho thấy có sự biến động nhẹ về số lượng trường học, trong đó một số loại có mức tăng nhẹ và những loại khác có mức giảm nhẹ trong thời gian ba năm.
Bài mẫu 2:
The table provides data on the number of schools in Vietnam from 2019 to 2021, categorized into upper secondary, lower secondary, and primary schools. During this course, there was a slight increase in the number of upper secondary schools, from 2,371 to 2,380. However, both lower secondary and primary schools underwent a reduction in numbers. Lower secondary schools decreased from 9,047 in 2019 to 8,744 in 2021, while for primary schools it was from 12,961 to 12,527. Overall, the trends indicate a small fluctuation in the number of schools, with one category experiencing a minor rise while the two others showing slight declines over the three-year period.
Tạm dịch:
Bảng số liệu cung cấp thông tin về số lượng trường học ở Việt Nam từ năm 2019 đến năm 2021, được phân thành các trường trung học phổ thông, trung học cơ sở và tiểu học. Trong khoảng thời gian này, số lượng trường trung học phổ thông có sự tăng nhẹ, từ 2.371 lên 2.380. Tuy nhiên, trường trung học cơ sở và tiểu học đều giảm số lượng. Trường trung học cơ sở giảm từ con số 9.047 vào năm 2019 xuống còn 8.744 vào năm 2021, trong khi trường tiểu học giảm từ 12.961 xuống 12.527. Nhìn chung, các xu hướng cho thấy sự biến động nhẹ về số lượng trường học, với một loại hình có sự gia tăng nhẹ, trong khi hai loại hình còn lại có sự giảm nhẹ trong vòng ba năm.
Bài mẫu 3:
The table shows the number of schools in Viet Nam from 2019 to 2021, including primary, lower secondary, and upper secondary schools.
Overall, the number of upper secondary schools stayed almost the same, increasing slightly from 2,371 in 2019 to 2,380 in 2021. The number of lower secondary schools decreased from 9,047 in 2019 to 8,744 in 2021. Similarly, primary schools also saw a drop, from 12,961 in 2019 to 12,527 in 2021.
This data shows that while the number of schools in Viet Nam remained high, both primary and lower secondary schools saw a small decline over the three years. Only upper secondary schools had a small increase.
In conclusion, the number of schools in Viet Nam did not change much, but there was a slight downward trend in primary and lower secondary schools.
Tạm dịch:
Bảng này cho thấy số trường học tại Việt Nam từ năm 2019 đến năm 2021, bao gồm trường tiểu học, trung học cơ sở và trung học phổ thông.
Nhìn chung, số trường trung học phổ thông gần như giữ nguyên, tăng nhẹ từ 2.371 trường năm 2019 lên 2.380 trường năm 2021. Số trường trung học cơ sở giảm từ 9.047 trường năm 2019 xuống 8.744 trường năm 2021. Tương tự, số trường tiểu học cũng giảm, từ 12.961 trường năm 2019 xuống 12.527 trường năm 2021.
Dữ liệu này cho thấy trong khi số trường học tại Việt Nam vẫn ở mức cao, thì cả trường tiểu học và trung học cơ sở đều giảm nhẹ trong ba năm. Chỉ có trường trung học phổ thông tăng nhẹ.
Tóm lại, số trường học tại Việt Nam không thay đổi nhiều, nhưng có xu hướng giảm nhẹ ở trường tiểu học và trung học cơ sở.

Các bài tập cùng chuyên đề
Bài 1 :
Description of pie charts
(Mô tả biểu đồ hình tròn)
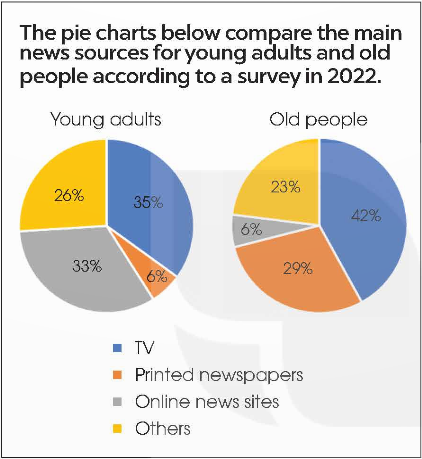
1. Work in pairs. Study the pie charts on page 96 and choose the correct answer A or B.
(Làm việc theo cặp. Nghiên cứu biểu đồ hình tròn ở trang 96 và chọn câu trả lời đúng A hoặc B.)
1. In general, which news source was very popular with both age groups?
A. Television.
B. Printed newspapers.
2. Which news source was least popular among young adults?
A. Printed newspapers.
B. Online news sites
3. Which news source was least popular among old people?
A. Printed newspapers.
B. Online news sites.
4. Printed newspapers were old people's _______ choice of news source.
A. top
B. second
5. Other sources of news were chosen by around _______ of the people in both age groups.
A. a quarter
B. half
Bài 2 :
2. Complete the following descriptions of the charts in 1. Use the words and phrases in the box.
(Hoàn thành các mô tả sau về biểu đồ trong phần 1. Sử dụng các từ và cụm từ trong hộp.)
|
as opposed to meanwhile while most popular |
The pie charts compare the main news sources for young adults and old people according to a survey in 2022.
Overall, television was the (1) _________ source of news for both age groups. It was chosen by 42 per cent of old people, and more than one third of young adults. (2) _________, more young adults turned to the Internet for news. The figure was 33 per cent for young adults (3) _________ just 6 per cent for old people. By contrast, printed newspapers were the second choice of news source for old people with 29 per cent (4) _________ only 6 per cent of young adults reported getting their news from printed newspapers. In both age groups, around a quarter relied on other sources for news.
Bài 3 :
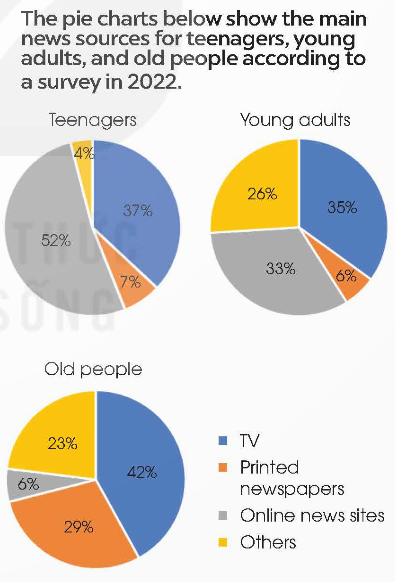
3. Write a description (120-150 words) of the charts below. Use the model and tips in 2 to help you.
(Viết mô tả (120-150 từ) về các biểu đồ bên dưới. Hãy sử dụng mô hình và mẹo ở phần 2 để giúp bạn.)
Bài 4 :
Writing Strategy
• Paraphrase the question as an introduction to the summary, using synonyms where appropriate.
• Select and report on 3 or 4 main features; you don't need to include every detail in the table.
• Describe the figures with expressions like the largest number, the smallest number ... Make comparisons if possible.
(Chiến lược viết
• Diễn giải câu hỏi như phần giới thiệu phần tóm tắt, sử dụng các từ đồng nghĩa khi thích hợp.
• Lựa chọn và báo cáo về 3 hoặc 4 đặc điểm chính; bạn không cần phải đưa mọi chi tiết vào bảng.
• Miêu tả các hình bằng các biểu thức như số lớn nhất, số nhỏ nhất... Hãy so sánh nếu có thể.)
Bài 5 :
3 Read the Writing Strategy. Did the writer follow all of the advice? Find and underline examples.
(Đọc Chiến lược viết. Người viết có làm theo tất cả những lời khuyên không? Tìm và gạch dưới các ví dụ.)
Bài 6 :
4 KEY PHRASES Look at the phrases below. Which are in the report?
(Nhìn vào các cụm từ dưới đây. Những cái nào có trong báo cáo?)
Introducing the table
The table shows...
The table presents/describes / gives information...
Giving remarks
First,...
Second,...
In contrast,...
Similarly,...
It would seem that...
In comparison with...
Bài 7 :
6. Read the task below. Write a report.
(Đọc nhiệm vụ dưới đây. Viết một báo cáo.)
The table presents the data for the percentage of people in Viet Nam using social networks in May 2022 and May 2023. In about 120-150 words, summarise the information in the table by selecting and reporting the main features, and making comparisons where relevant.
(Bảng trình bày số liệu về tỷ lệ phần trăm người dân Việt Nam sử dụng mạng xã hội trong tháng 5 năm 2022 và tháng 5 năm 2023. Trong khoảng 120-150 từ, hãy tóm tắt thông tin trong bảng bằng cách chọn lọc và báo cáo những đặc điểm chính, đồng thời đưa ra so sánh nếu phù hợp.)
The percentage of social media users in Viet Nam compared to the total population (Statcounter)
(Tỷ lệ người dùng mạng xã hội ở Việt Nam so với tổng dân số)
|
Social media |
May 2022 |
May 2023 |
|
|
62.3 % |
77.2 % |
|
YouTube |
14.4 % |
5.2 % |
|
|
0.5 % |
2.2 % |
|
|
4.1 % |
2.6 % |
Bài 8 :
a. Read about writing introductions for problem-solution essays, then read David's essay again and underline the general statement and the thesis statement.
(Đọc về cách viết phần giới thiệu cho các bài luận giải quyết vấn đề, sau đó đọc lại bài luận của David và gạch chân tuyên bố chung và tuyên bố luận điểm.)
Writing introductions for problem-solution essays
(Viết lời giới thiệu cho bài luận giải quyết vấn đề)
To write a good introduction fa a problem-solution essay, you should:
(Để viết phần giới thiệu hay cho một bài luận giải quyết vấn đề, bạn nên:)
1. Introduce the topic with a general statement. This should mention a simple fact about the overall topic.
(Giới thiệu chủ đề bằng một câu khái quát. Điều này nên đề cập đến một thực tế đơn giản về chủ đề tổng thể.)
Teenagers enjoy spending their free time on the internet.
(Thanh thiếu niên thích dành thời gian rảnh của họ trên internet.)
2. Introduce the problem and say why it is a problem. This should contrast with or add to your general statement.
(Giới thiệu vấn đề và cho biết tại sao lại là vấn đề. Điều này sẽ tương phản hoặc bổ sung vào tuyên bố chung của bạn.)
However, spending too much time on the internet is unhealthy for teens and can cause a lots of problems.
(Tuy nhiên, dành quá nhiều thời gian trên Internet không tốt cho thanh thiếu niên và có thể gây ra nhiều vấn đề.)
3. Write a thesis statement. This should briefly introduce what the essay will say and all the solutions you are going to talk about
( Viết luận điểm. Phần này sẽ giới thiệu ngắn gọn những gì bài luận sẽ nói và tất cả các giải pháp bạn sẽ nói đến)
This essay will explain some problems with using the internet, and how to use it effectively and safety.
(Bài viết này sẽ giải thích một số vấn đề khi sử dụng Internet cũng như cách sử dụng nó một cách hiệu quả và an toàn.)
Bài 9 :
b. Write G for the general statement, P for problem, and T for the thesis statement, then put them in the correct order by writing a number (1-3).
(Viết G cho câu tổng quát, P cho vấn đề, và T cho câu luận điểm, sau đó sắp xếp chúng theo đúng thứ tự bằng cách viết một số (1-3).)
a. This essay will explain the biggest problems of smartphones, and how spending less time on them and understanding them more can reduce the problems.
(Bài luận này sẽ giải thích những vấn đề lớn nhất của điện thoại thông minh cũng như việc dành ít thời gian hơn cho chúng và hiểu chúng nhiều hơn có thể giảm thiểu các vấn đề như thế nào.)
b. However, smartphones can cause many problems in the lives of teenagers.
(Tuy nhiên. điện thoại thông minh có thể gây ra nhiều vấn đề trong cuộc sống của thanh thiếu niên.)
c. These days, many teenagers enjoy using smartphones at home and at school.
(Ngày nay, nhiều thanh thiếu niên thích sử dụng điện thoại thông minh ở nhà và ở trường.)
Bài 10 :
a. Read David's essay again. In which paragraphs do you see the following phrases? Write the paragraph numbers (1-5) on the lines. Some phrases aren't used.
(Đọc lại bài luận của David. Bạn thấy những cụm từ sau ở đoạn văn nào? Viết số đoạn văn (1-5) trên các dòng. Một số cụm từ không được sử dụng.)
A.... is a major problem. (là một vấn đề lớn)
B. One solution is ... (một giải pháp là)
C. One of the biggest things/problems/risks ... (một trong những mối nguy/vấn đề/ thứ lớn nhất là)
D. (Teens) should ... (thanh niên nên)
E. I suggest that ... (tôi gợi ý rằng)
F.... is another main risk for teens. (là một nguy cơ khác cho thanh niên)
Bài 11 :
a. Match the useful phrases above to their purpose. Write the letters (A—F) on the lines.
(Nối các cụm từ hữu ích ở trên với mục đích của chúng. Viết các chữ cái (A—F) trên các dòng.)
1. ____ :to introduce problems (giới thiệu vấn đề)
2. : to introduce solutions (giới thiệu giải pháp)
Bài 12 :
Now, write a problem-solution essay on the biggest risks on the internet for teenagers. Use the Writing Skill box, the reading model, and your speaking notes to help you. Write 180-200 words.
(Bây giờ, hãy viết một bài luận giải quyết vấn đề về những rủi ro lớn nhất trên Internet đối với thanh thiếu niên.
Sử dụng hộp Kỹ năng Viết, mẫu bài đọc và ghi chú nói của bạn để giúp bạn. Viết 180-200 từ.)
Bài 13 :
a. In pairs: Check one of your partner's final writing passages for Units 6-8 using Feedback forms from the lessons.
(Theo cặp: Kiểm tra một trong những đoạn viết cuối cùng của bạn mình cho Bài 6-8 bằng cách sử dụng biểu mẫu Phản hồi từ các bài học.)
Bài 14 :
b. Make a list of things you need to remember for your future writing.
(Lập danh sách những điều bạn cần ghi nhớ cho bài viết sau này của mình.)
Bài 15 :
c. Compare your list with another group and add anything you think is useful.
( So sánh danh sách của bạn với một nhóm khác và thêm bất cứ điều gì bạn cho là hữu ích.)
Bài 16 :
2. Which paragraph in the report in Exercise 1 ...
(Đoạn văn nào trong báo cáo của bài 1…)
1. summarises and explains what the results indicate?
(tổng kết và giải thích những thứ kế quả chỉ ra?)
2. expresses the purpose of the chart and the general trend?
(thể hiện mục tiêu của biểu đồ và xu thế chung?)
3. describes and compares the chart sections?
(mô tả và so sánh các phần?)
Bài 17 :
3. Read the report again. Underline the words/phrases whose meanings are similar to those in the Useful Language box.
(Đọc lại bài báo cáo lần nữa. Gạch chân dưới các từ/cụm từ có nghĩa giống với nghĩa của những từ/cụm từ trong Hộp Ngôn ngữ Thông dụng.)
|
Useful Language Box (Hộp Ngôn ngữ Thông dụng.) |
|
• represents (miêu tả, trình bày) • demonstrates (biểu diễn) • shows (thể hiện) • segment (đoạn, khúc) • part (phần) • share (phần (đóng góp...)) • comprised (bao gồm) • constituted (được tạo thành) • made up (cấu thành) • Besides (Bên cạnh đó) • In addition (Thêm vào đó) • Moreover (Hơn nữa) • While (Trong khi) • On the other hand (Mặt khác) • However (Tuy nhiên) • Whereas (Trong khi) • In general (Nhìn chung) • All in all (Nói tóm lại) • In conclusion (Kết luận) |
Bài 18 :
5. Write a report using the information from the pie chart in Exercise 4 (about 180-200 words).
(Viết một bài báo cáo dùng các thông tin từ biểu đồ tròn ở bài tập 4. (khoảng 180 – 200 từ))
Paragraph 1: writing about the purpose of the chart, describing the general trend
(Đoạn 1: viết về mục đích của biểu đồ, mô tả xu hướng chung)
Paragraph 2: describing and comparing the sections of the chart in detail
(Đoạn 2: mô tả và so sánh chi tiết các phần của biểu đồ)
Paragraph 3: summarising the chart and explaining what the results indicate
(Đoạn 3: tóm tắt biểu đồ và giải thích những điều kết quả chỉ ra.)
Bài 19 :
6. Check your report for spelling/grammar mistakes. Then, in pairs, swap your reports and check each other's work.
(Kiểm tra lỗi chính tả và lỗi ngữ pháp. Sau đó, theo cặp, đổi bài cho nhau và chấm bài.)
Bài 20 :
Writing (Viết)
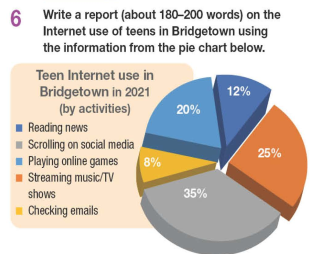
6. Write a report (about 180-200 words) on the Internet use of teens in Bridgetown using the information from the pie chart below.
(Viết một báo cáo (180-200 từ) về việc sử dụng Internet của thanh thiếu niên ở Bridgetown dùng các thông tin từ biểu đồ tròn bên dưới.)
|
Teen Internet use in Bridgetown in 2021 (by activities) (Việc sử dụng Internet của thanh thiếu niên ở Bridgetown – theo hoạt động) Reading news: 12% (Đọc tin tức: 12%) Scrolling on social media: 35% (Lướt mạng xã hội: 35%) Playing online games: 20% (Chơi trò chơi trực tuyến: 20%) Streaming music/TV shows: 25% (Nghe nhạc/ Xem tivi trực tuyến: 25%) Checking emalls : 8% (Kiểm tra thư điện tử: 8%) |
 |
Bài 21 :
4. Read the WRITING FOCUS and find examples of each point in the review.
(Đọc TRỌNG TÂM VIẾT và tìm ví dụ về từng điểm trong bài đánh giá.)
|
WRITING FOCUS A review The goal of a review is to give your personal opinion about something, e.g. a film, a series or a book. The opinion should be supported with examples and recommendations should be given at the end. Reviews are usually written for newspapers, websites or magazines and therefore have a fairly informal style. Introduction • Attract readers' attention with an interesting opening sentence. • Mention the type of show, the stars/director/ writer, the setting, obvious influences, etc. • State your overall opinion. Main paragraphs • Use present tenses to give more details about the plot and the main characters. • Use present or past tenses to say what you liked/ didn't like about the TV series. • Use a variety of adjectives and modifiers when presenting your opinions. Conclusion • Summarise your review. • Make recommendations. |
|
TẬP TRUNG VIẾT Đánh giá Mục tiêu của đánh giá là đưa ra ý kiến cá nhân của bạn về điều gì đó, ví dụ: một bộ phim, một bộ truyện hay một cuốn sách. Ý kiến cần được hỗ trợ bằng các ví dụ và khuyến nghị nên được đưa ra ở cuối. Các bài đánh giá thường được viết cho các tờ báo, trang web hoặc tạp chí và do đó có phong cách khá thân mật. Giới thiệu • Thu hút sự chú ý của người đọc bằng câu mở đầu thú vị. • Đề cập đến loại chương trình, ngôi sao/đạo diễn/ nhà văn, bối cảnh, những ảnh hưởng rõ ràng, v.v. • Nêu ý kiến chung của bạn. Đoạn văn chính • Dùng thì hiện tại để cung cấp thêm chi tiết về cốt truyện và các nhân vật chính. • Dùng thì hiện tại hoặc quá khứ để nói điều bạn thích/không thích về bộ phim truyền hình. • Sử dụng nhiều tính từ và từ bổ nghĩa khi trình bày ý kiến của mình. Phần kết luận • Tóm tắt đánh giá của bạn. • Kiến nghị. |
Bài 22 :
6. Choose a TV series you like that is currently on TV. Write a review (180-200 words) to describe the series.
(Chọn một bộ phim truyền hình bạn thích hiện đang chiếu trên TV. Viết bình luận (180-200 từ) để mô tả bộ truyện.)
Bài 23 :
4. Read the writing task and write a review.
(Đọc bài viết và viết bình luận.)
What is your favourite film genre? Comedy, action movie, romantic comedy or something else? Write a review for a film which is the best representation of your favourite genre and could encourage viewers to watch more films of that type.
(Thể loại phim yêu thích của bạn là gì? Phim hài, phim hành động, phim hài lãng mạn hay gì khác? Viết bài đánh giá cho một bộ phim thể hiện tốt nhất thể loại yêu thích của bạn và có thể khuyến khích người xem xem nhiều phim thuộc thể loại đó hơn.)
Bài 24 :
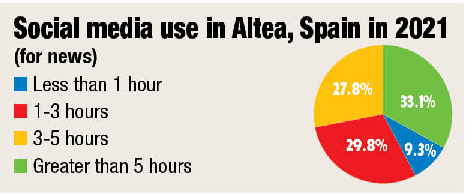
Writing a pie chart report (Viết báo cáo về biểu đồ tròn)
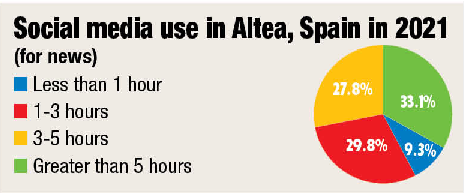
(Lượng sử dụng mạng xã hội để xem tin tức ở Altea, Tây Ban Nha vào năm 2021
- Ít hơn 1 tiếng đồng hồ
- 1 đến 3 tiếng đồng hồ
- 3 đến 5 tiếng đồng hồ
- Nhiều hơn 5 tiếng đồng hồ)
1. Read the report and fill in the gaps (1-5) with one suitable word from the list.
(Đọc bài báo cáo và điền vào các chỗ trống (1-5) với một từ phù hợp từ danh sách.)
• overall • illustrates • majority • 27,8 % • by contrast
This pie chart 1) _____ the results of a recent survey on social media use. The survey was conducted at a small village Altea in Spain in 2021 and categorised the social media use by the amount of time spent.
2) _____ the chart indicates that the community at Altea relies on social media as their primary source of news. According to the most significant portion, 33.1% of users go online approximately more than 5 hours a day. Next to that, with a lower portion of the total 3) _____ of the users are on social media for 3 to 5 hours. 4) _____ only 9.3 % of the locals use the Internet for less than 1 hour to keep up to date with the latest news. Furthermore, 29,8 % of the users spent 1-3 hours on social media.
All in all, it is evident from the survey data that the 5) _____ of the Spanish village residents use social media as their primary source of information, while those who do not spend much time online account for only a low percentage.
Bài 25 :
2. Read the sentences (1-5) and replace the words or phrases in bold with those in the list.
(Đọc các câu (1-5) và thay thế các từ hoặc cụm từ in đậm với các từ bên từ trong danh sách.)
• with reference to • while • Moreover • indicates • in conclusion
1. All in all, more people listen to podcasts than they did five years ago.
2. The chart shows a very interesting trend.
3. Furthermore, we see that 1 in 3 women post stories on an everyday basis.
4. According to the graph, 32% Internet users are women, whereas 68% are man.
5. Regarding the most significant portion of the graph, it is clear that those watching television outnumber those reading news online.
Bài 26 :
3. Read the pie chart about television viewers in the Spanish village and match the questions with the answers.
(Đọc biểu đồ tròn về số người xem ti vi ở một làng ở Tây Ban Nha và nối các câu hỏi với câu trả lời.)
(Việc sử dụng tivi ở Altea, Tây Ban Nha trong năm 2022 (dành cho tin tức và giải trí)
(235 phản hồi ở Altea, Tây Ban Nha)
ít hơn 1 tiếng; 1 đến 2 tiếng; 3 đến 5 tiếng; nhiều hơn 5 tiếng
|
1. ___ What does the chart show? 2. ___ What is the visible trend that the chart indicates? 3. ___ What is the main conclusion that can be drawn regarding the results of the chart? |
a. People in the village most likely to reply on television as their primary source of news and entertainment. b. Most residents of the village spent long hours using television to get their news and for entertainment, while those who spent little time in front of the TV accounted for only 8% of total use in the area. c. The amount of time spent on watching television. |
Bài 27 :
5. Write a report using the information from the pie chart in Exercise 3 (about 180-200 words).
(Viết một báo dùng thông tin từ biểu đồ tròn trong Bài tập 3 (khoảng 180 – 200 từ.)
Paragraph 1: writing about the purpose of the chart, describing the general trend
(Đoạn 1: viết về mục đích của biểu đồ, mô tả xu hướng chung)
Paragraph 2: describing and comparing the sections of the chart in detail
(Đoạn 2: mô tả và so sánh chi tiết các phần của biểu đồ)
Paragraph 3: summarising the chart and explaining what the results indicate
(Đoạn 3: tóm tắt biểu đồ và giải thích những điều kết quả chỉ ra.)
Bài 28 :
Writing (Viết)
Writing a pie chart report (Viết một báo cáo biểu đồ tròn)
5. Read the report and put the paragraphs in the correct order.
(Đọc báo cáo và xếp các đoạn văn theo thứ tự đúng.)
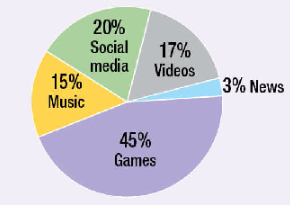
Tablet use in the people aged 18-23 in York.
45% Games (45% trò chơi)
20% Social media (20% mạng xã hội)
17% Video (17% xem vi-đê-ô)
15% Music (15% âm nhạc)
3% News (3% tin tức)
A. ___ All in all, it is clear from the data gathered above that the majority of young tablet users prefer to play games and use social media, whereas a very small percentage of them listen to music or read the news online.
B. ___ This chart illustrates the results of a recent survey about tablet use conducted in York. It categorises tablet use by types of activities. Overall, the graph indicates a visible trend that children and young adults play games on their tablets.
C. ___ With reference to the most significant portion of the chart, playing games accounts for 45% of the users. Next to that, with a lower portion of the total, 20% of young users use tablets to go on social media. On the other hand, those who watch videos make up only 17% of the young population. Furthermore, we should take note of the fact that only 15% and 3% of young users listen to music and read the news on their tablets, respectively.
Bài 29 :
6. Write a report using the information from the pie chart below (about 180-200 words).
(Viết một báo cáo dùng thông tin trong biểu đồ tròn bên dưới (180 – 200 từ.)
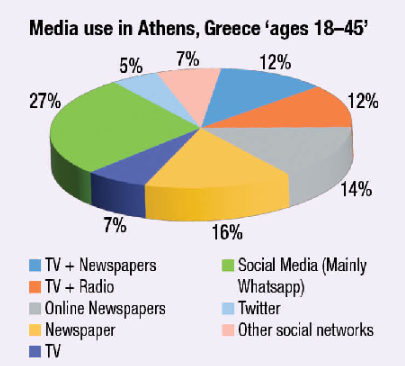
Media use in Athens, Greece ‘ages 18 – 45’
TV + Newspapers: 12%
TV + Radio: 12%
Online Newspapers: 14%
Newspapers: 16%
TV: 7%
Social media (Mainly Whatsapp): 27%
Twitter: 5%
Other social networks: 7%
(Việc sử dụng phương tiện truyền thông ở Athen Greece ở độ tuổi 18 – 45)
TV + Báo giấy: 12%
TV + Radio: 12%
Báo mạng: 14%
Báo giấy: 16%
TV: 7%
Mạng xã hội (chủ yếu là Whatsapp): 27%
Twitter: 5%
Các mạng xã hội khác: 7%
Paragraph 1: writing about the purpose of the chart, describing the general trend
(Đoạn 1: viết về mục đích của biểu đồ, mô tả xu hướng chung)
Paragraph 2: describing and comparing the sections of the chart in detail
(Đoạn 2: mô tả và so sánh chi tiết các phần của biểu đồ)
Paragraph 3: summarising the chart and explaining what the results indicate
(Đoạn 3: tóm tắt biểu đồ và giải thích những điều kết quả chỉ ra.)
Bài 30 :
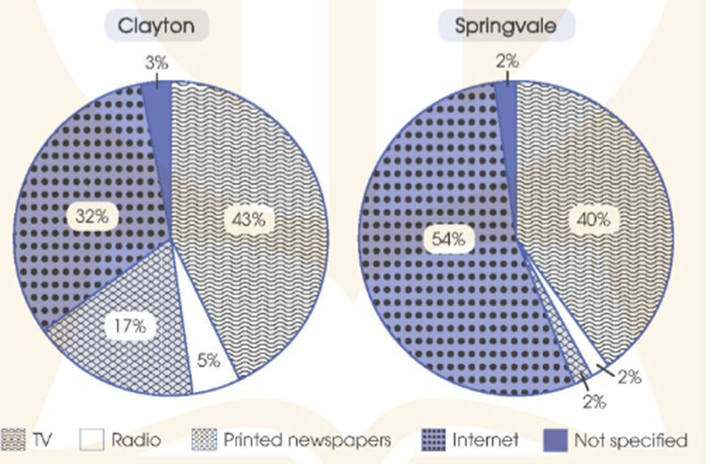
3 The charts below show the most common ways for people in two cities, Clayton and Springvale, to get daily news in 2020. Write a report (120-150 words) to describe and compare the data.
(Biểu đồ bên dưới cho thấy những cách phổ biến nhất để người dân ở hai thành phố Clayton và Springvale nhận được tin tức hàng ngày trong năm 2020. Viết báo cáo (120-150 từ) để mô tả và so sánh dữ liệu.)


Danh sách bình luận